Francisco Javier Cruces Doval
Thursday, April 17, 2025 | 3 minutes
Installing Prometheus with docker-compose and Node Exporter on Debian 12
This guide is an introductory tutorial that shows how to install, configure, and use a basic instance of Prometheus using Docker Compose. Additionally, a Linux machine (in this case Debian 12) will be configured to expose its system metrics, which will be collected by Prometheus using Node Exporter.
Prerequisites
- Docker and Docker Compose installed
- A Linux machine with administrator privileges
Creating files
Creating the docker-compose
All the files used in this post can be found in my github.
The first thing we will do is create our docker-compose file.
Here we highlight two aspects:
- Prometheus works on port 9090; in my case, I will keep it and not change it.
- The configuration file added to the container makes it easier to modify the configuration.
javiercruces@HPOMEN15:~/learn_observability/exercise1$ cat docker-compose.yaml
version: '3.8'

services:
  prometheus:
    image: prom/prometheus:latest
    container_name: prometheus
    ports:
      - "9090:9090"
    volumes:
      - ./prometheus.yml:/etc/prometheus/prometheus.yml
Creating the prometheus.yml file
The prometheus.yml file is the main Prometheus configuration file. In it, we define global parameters and the targets from which Prometheus will collect metrics. Labels and scrape intervals can also be customized.
In this example from Prometheus’ getting started page, we add our Debian 12 machine. Since Prometheus runs in Docker, I added the network’s gateway IP, which corresponds to my physical Debian 12 machine.
For more details on all available options, see the official Prometheus documentation.
global:
  scrape_interval: 15s

  external_labels:
    monitor: 'javiercd-metrics'

scrape_configs:
  - job_name: 'prometheus'
    scrape_interval: 5s
    static_configs:
      - targets: ['localhost:9090']

  - job_name: 'node-exporter-debian12'
    scrape_interval: 5s
    static_configs:
      - targets: ['172.17.0.1:9100']
Node Exporter Configuration on Debian 12
To allow Prometheus to collect OS metrics, we’ll install Node Exporter, a service that exposes system metrics for Prometheus to scrape.
Package Installation
Run the following command to install prometheus-node-exporter from the Debian repositories:
javiercruces@HPOMEN15:~/learn_observability/exercise1$ sudo apt install prometheus-node-exporter
Service Verification
Once installed, the daemon will run automatically. You can use the following command to confirm:
javiercruces@HPOMEN15:~/learn_observability/exercise1$ sudo systemctl is-enabled prometheus-node-exporter
enabled
You can also get more information with this command:
Expected output (summary):
javiercruces@HPOMEN15:~/learn_observability/exercise1$ sudo systemctl status prometheus-node-exporter
● prometheus-node-exporter.service - Prometheus exporter for machine metrics
     Loaded: loaded (/lib/systemd/system/prometheus-node-exporter.service; enabled; preset: enabled)
     Active: active (running) since Sat 2025-05-17 01:59:00 CEST; 1min 10s ago
       Docs: https://github.com/prometheus/node_exporter
   Main PID: 8488 (prometheus-node)
      Tasks: 6 (limit: 18302)
     Memory: 3.7M
        CPU: 6ms
     CGroup: /system.slice/prometheus-node-exporter.service
             └─8488 /usr/bin/prometheus-node-exporter

...
Note in the last lines that it is listening on port 9100. Additional info:
- Systemd unit file path:
/lib/systemd/system/prometheus-node-exporter.service - Node exporter config path:
/etc/default/prometheus-node-exporter
Bringing Up the Stack
Once the Prometheus configuration file is ready and Node Exporter is running, let’s bring up Prometheus:
javiercruces@HPOMEN15:~/learn_observability/exercise1$ docker compose up -d
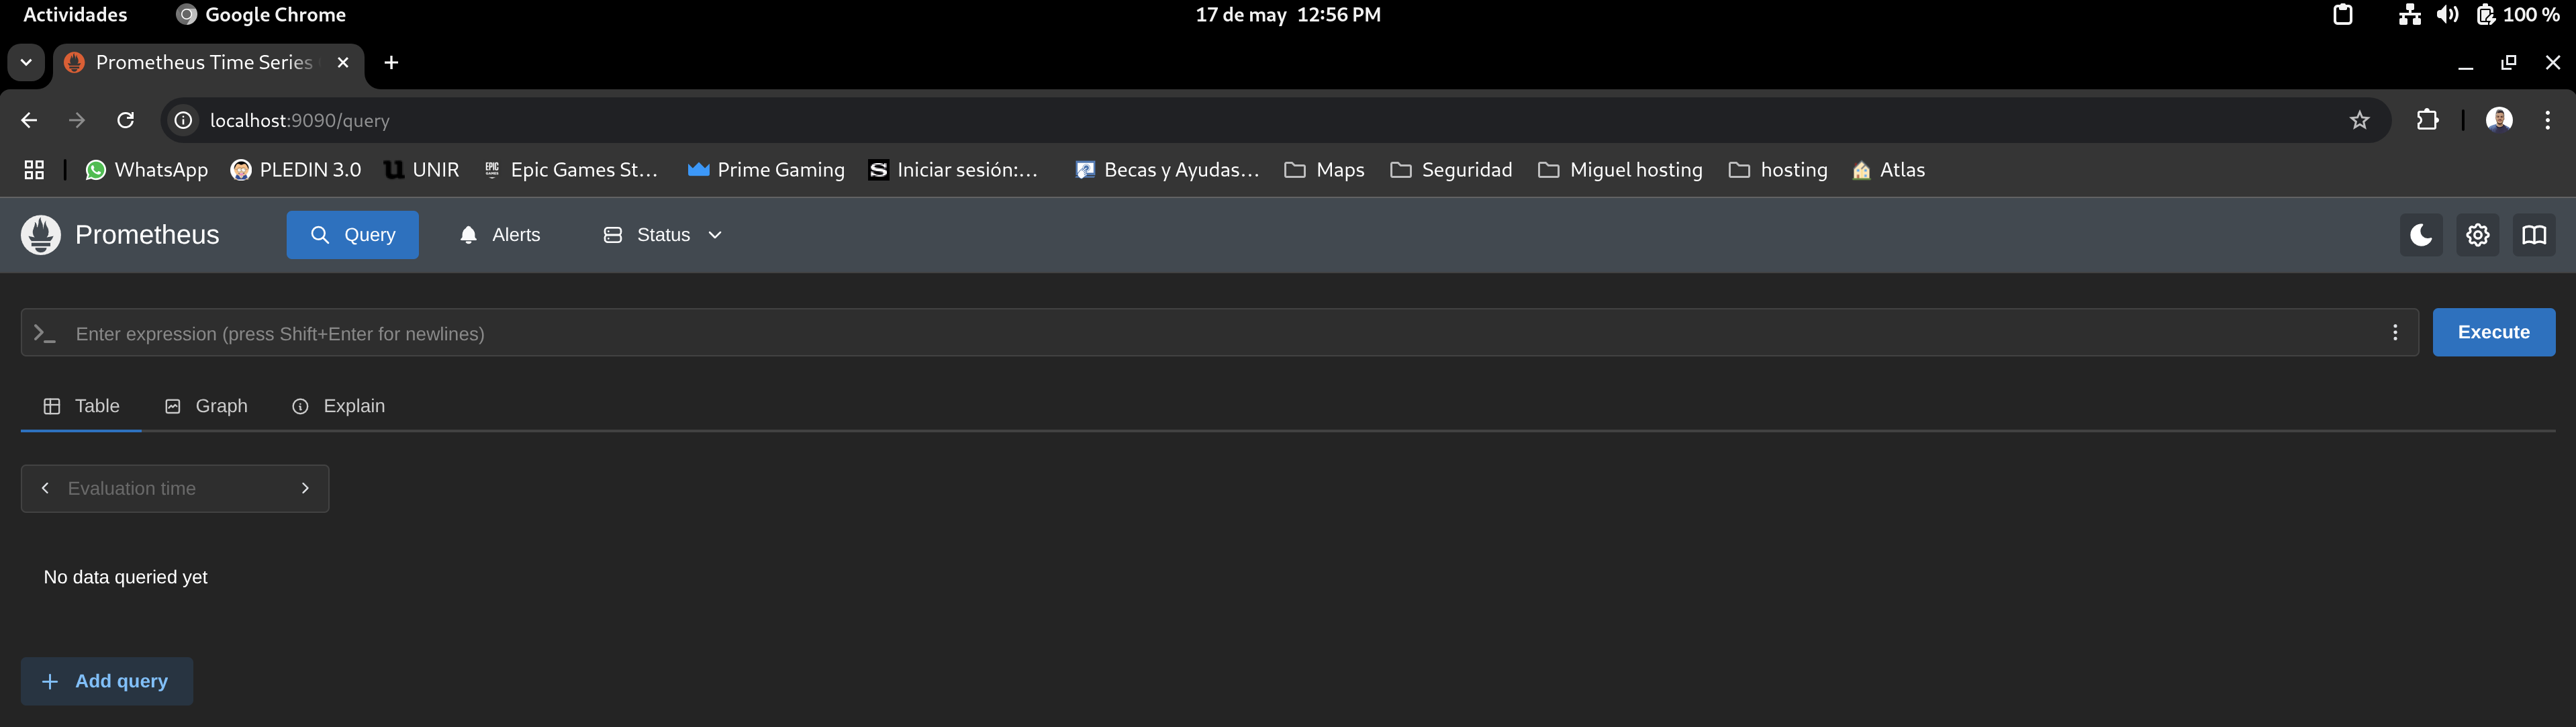
Once up, open your browser and go to the port Prometheus is exposed on (9090 in my case):
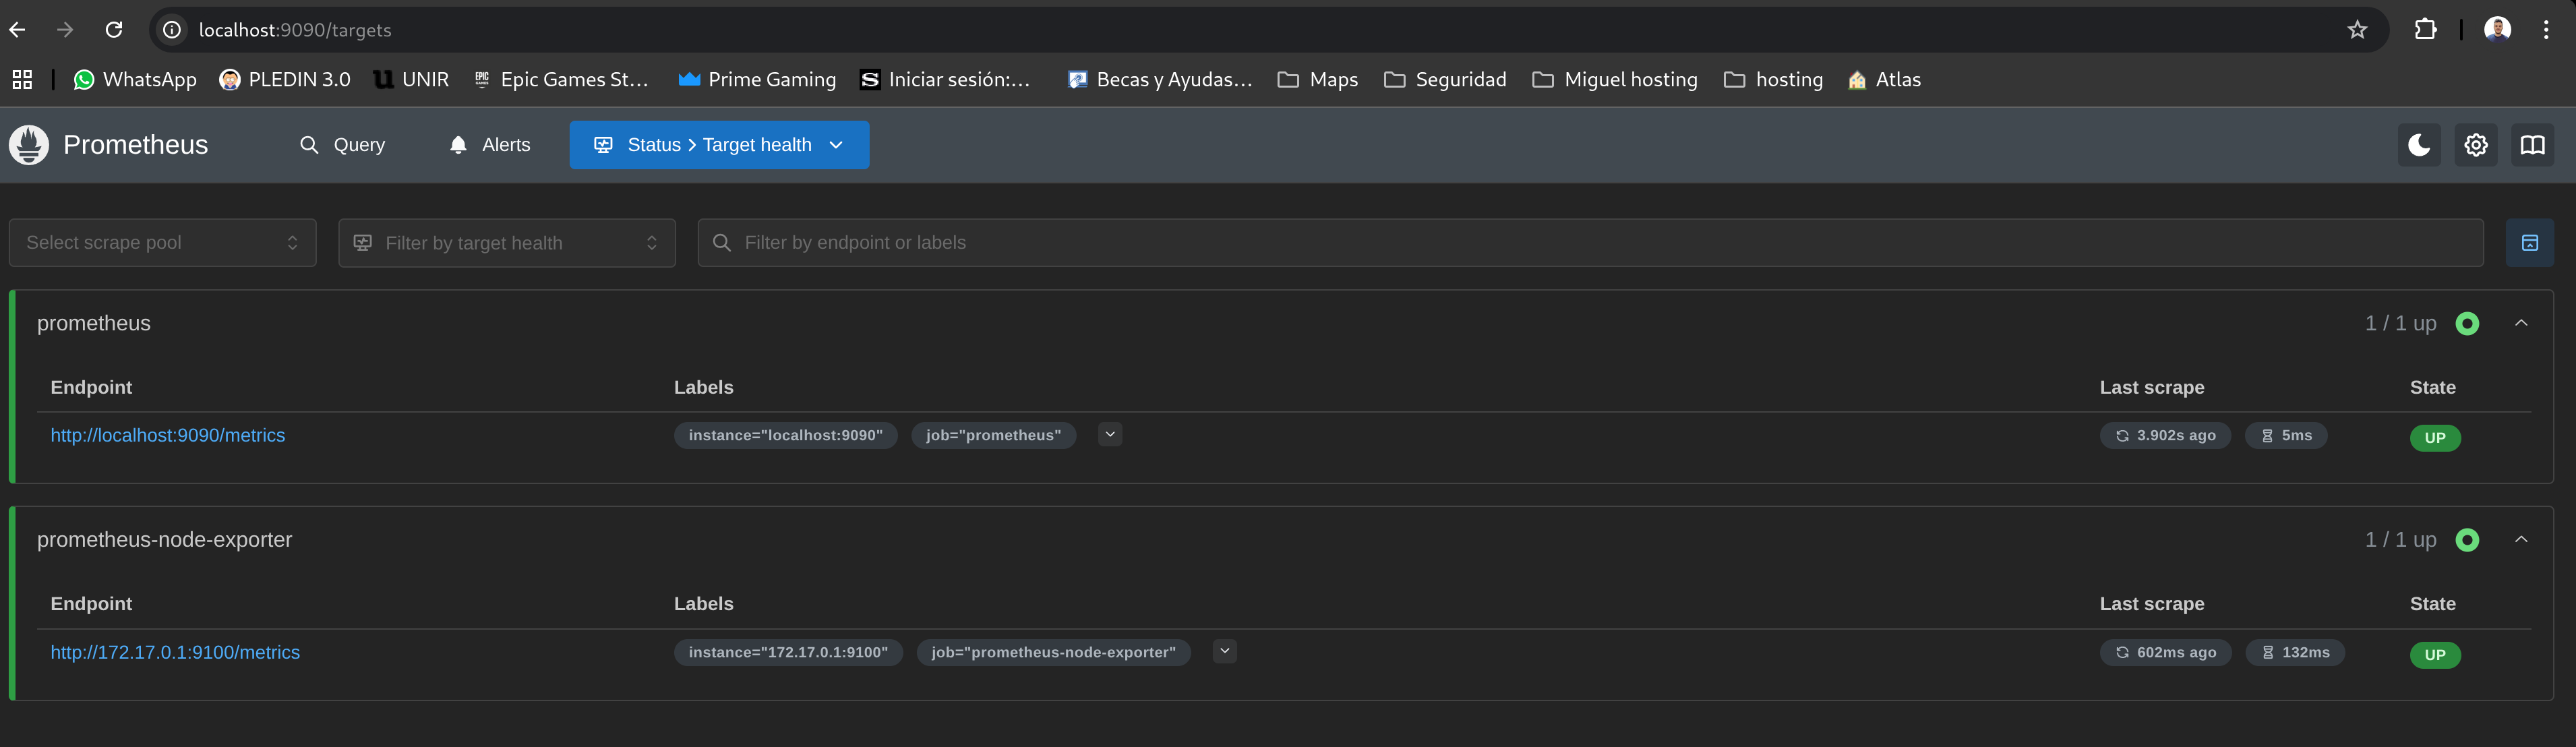
Check if Prometheus is receiving metrics from Debian 12 at http://localhost:9090/targets. If everything is running, metrics should be visible:
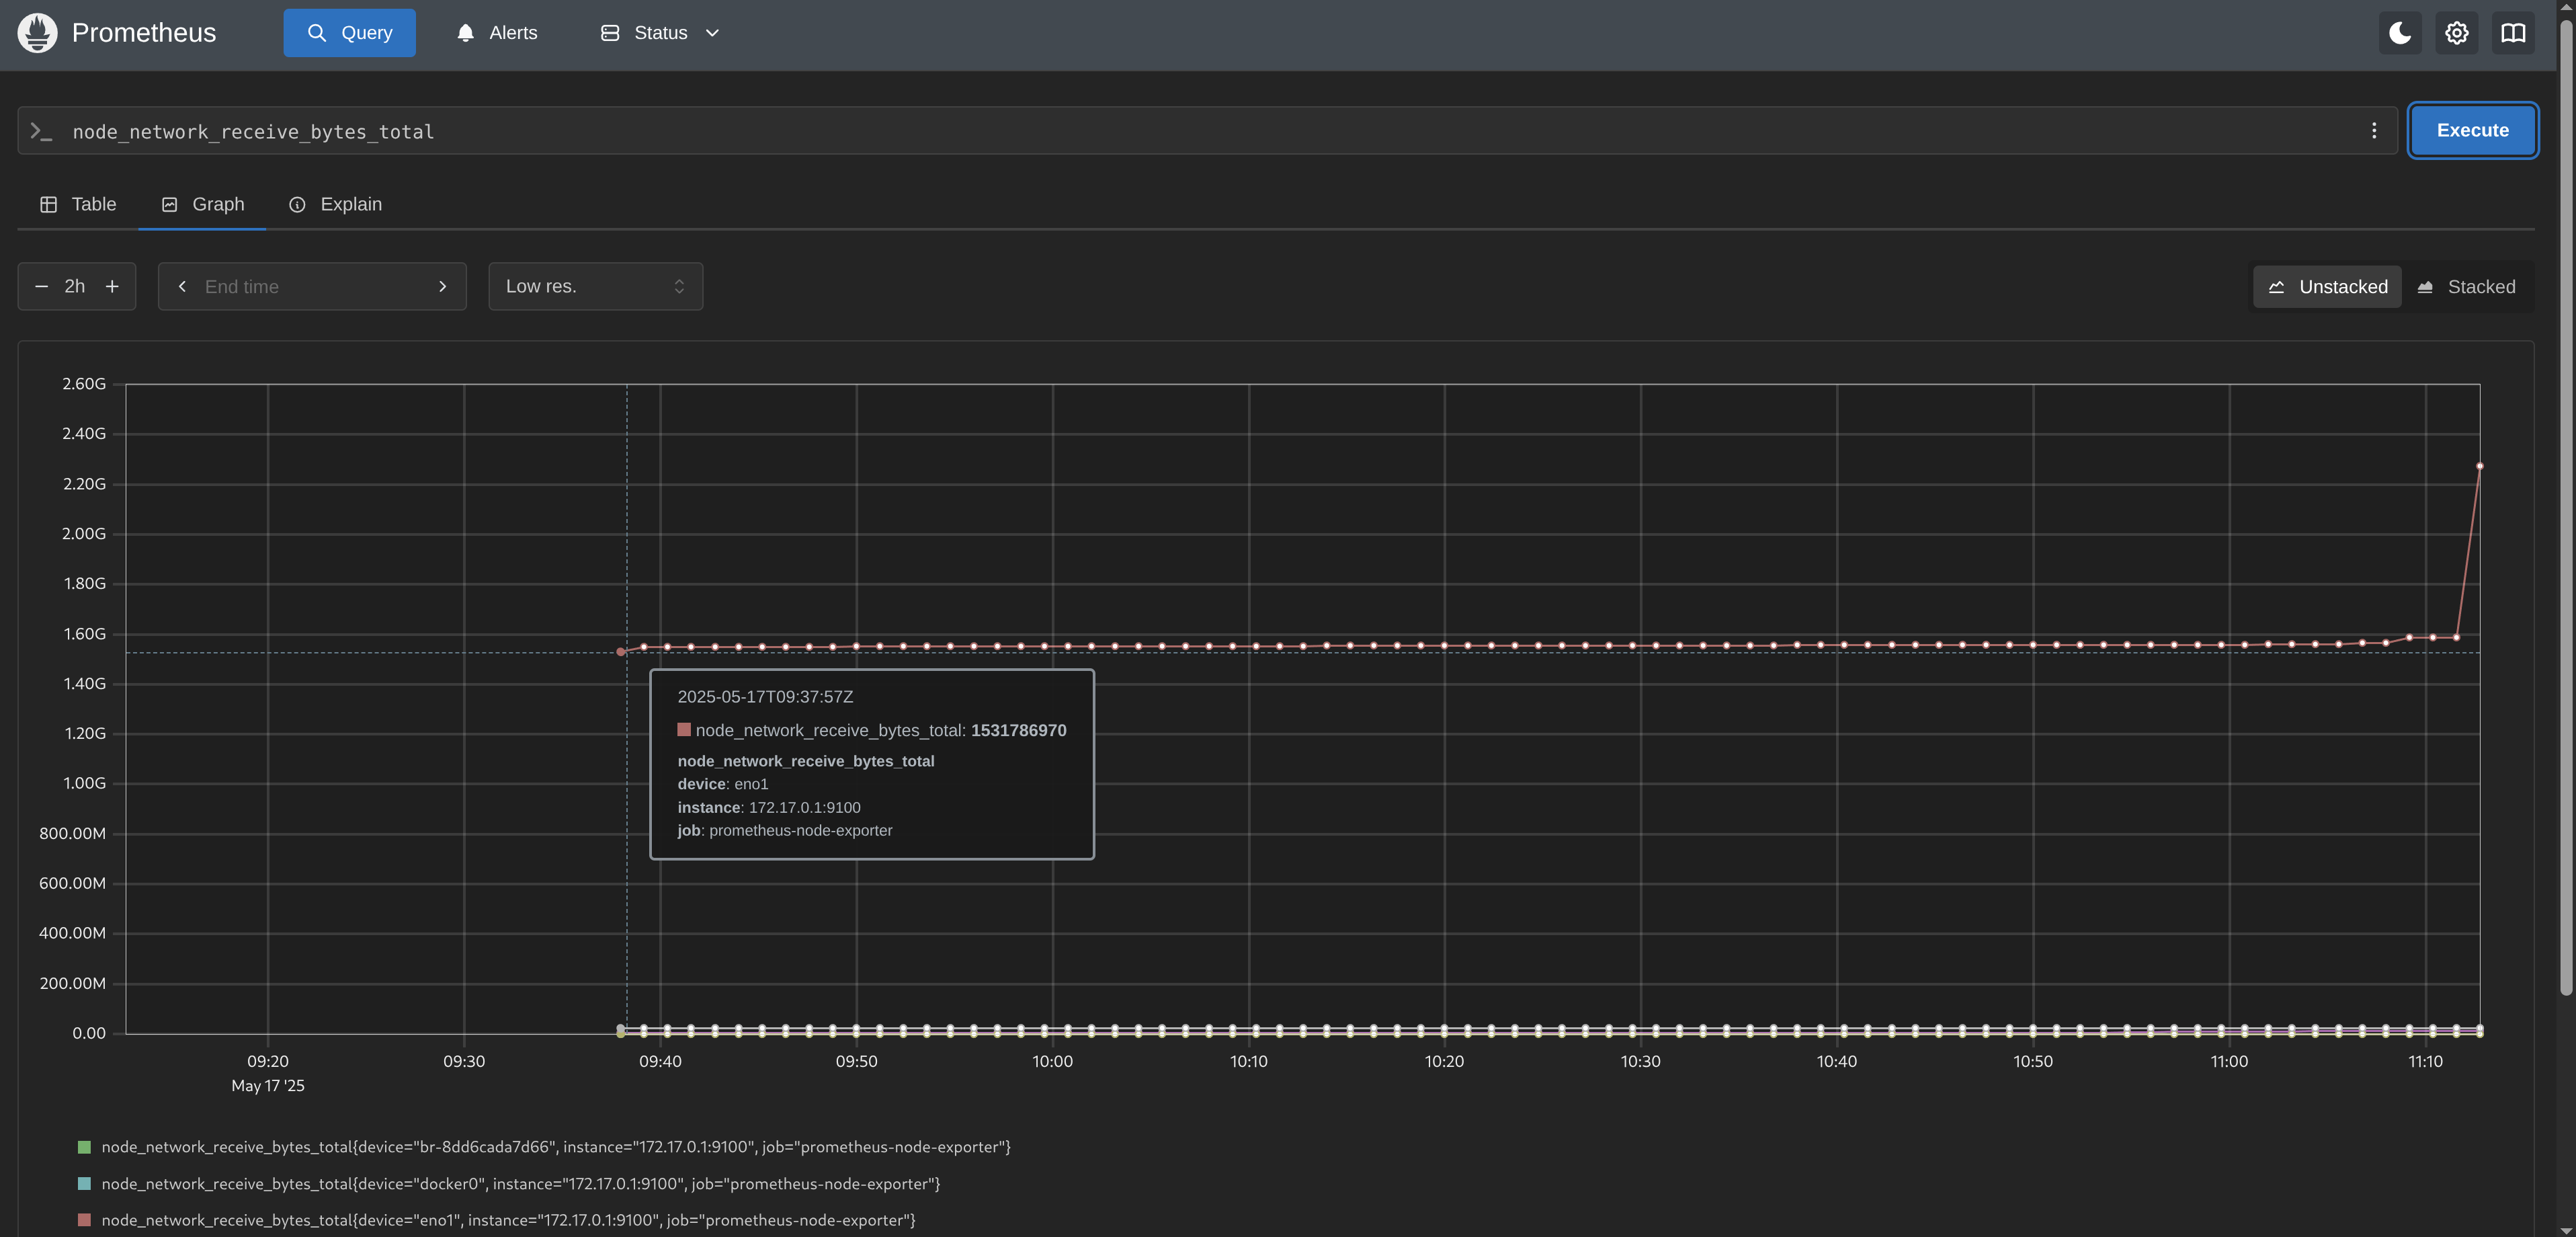
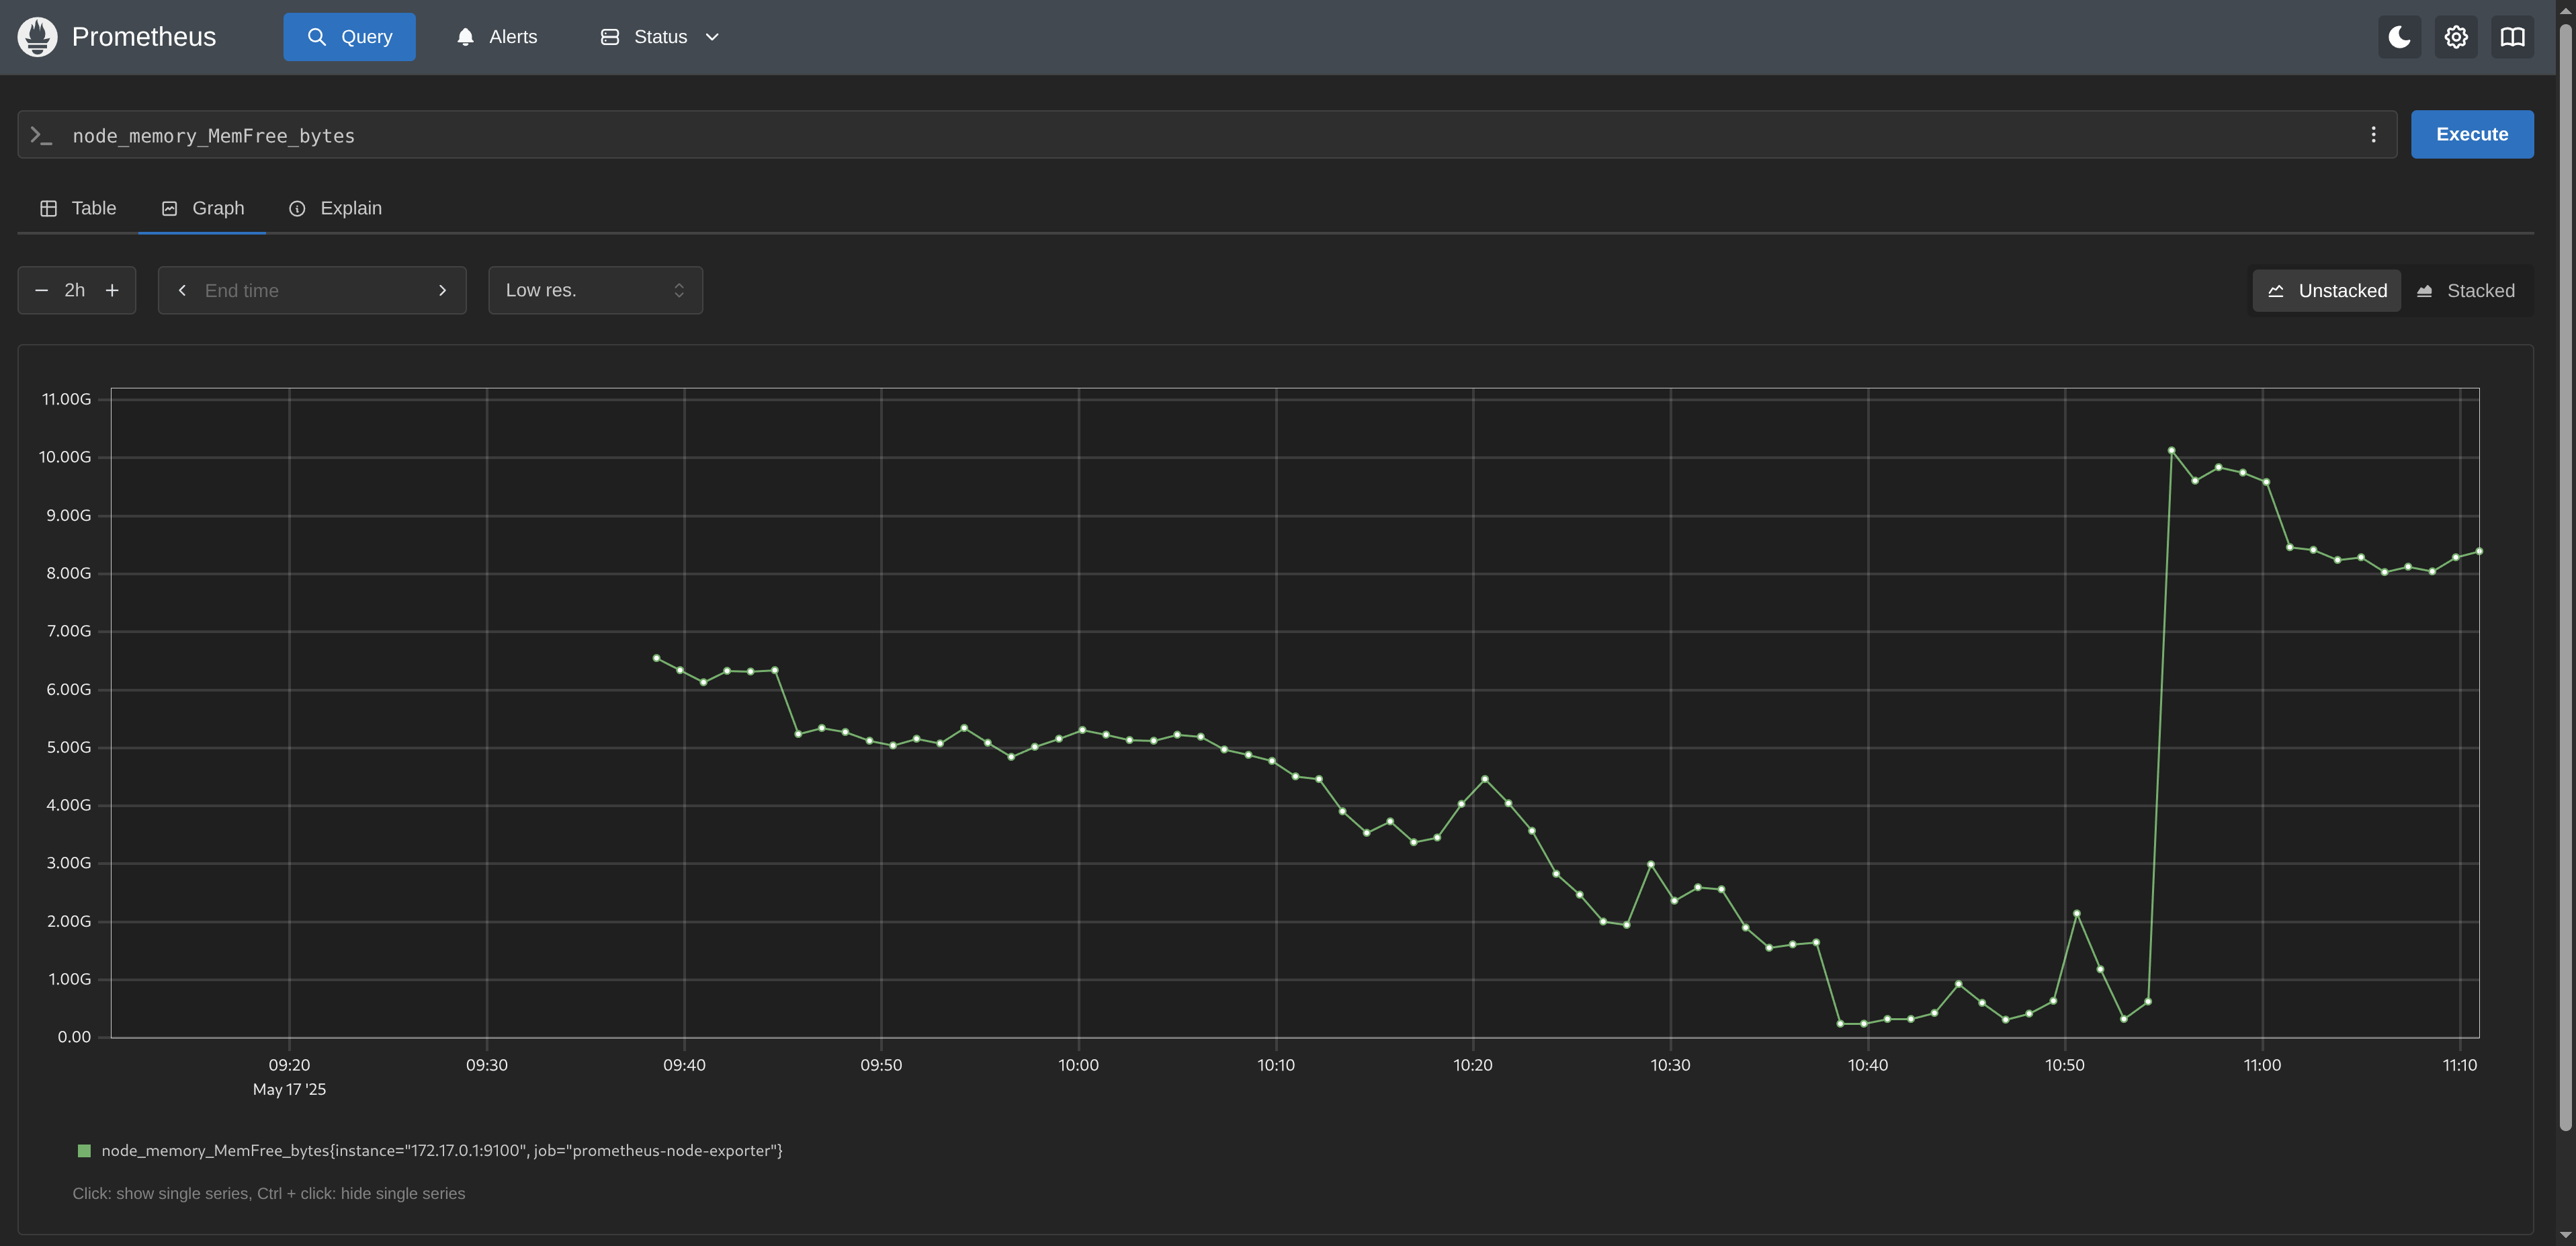
Lastly, let’s query a couple of metrics: